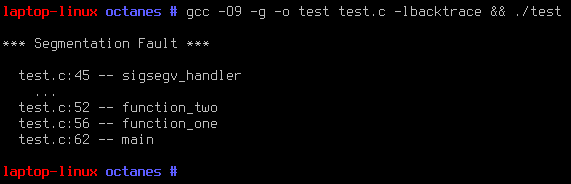
So after this thing crashed after using it for like 30 minutes, I was wishing I knew where it crashed, but I hate gdb. So while looking into how to enable core files and get backtraces from them, I discovered a library called 'libbacktrace' which lets you put backtraces into your program. So now when it crashes, it'll display something like this:
Here's the program that made that. If you want this in your own programs then you might want it as an example.
#include <stdio.h>
#include <string.h>
#include <signal.h>
#include <backtrace.h>
/*
A libbacktrace example program.
libbacktrace is found at https://github.com/ianlancetaylor/libbacktrace
Compile this file with: gcc -g -o test test.c -lbacktrace
*/
static void error_callback (void *data, const char *message, int error_number) {
if (error_number == -1) {
fprintf(stderr, "If you want backtraces, you have to compile with -g\n\n");
_Exit(1);
} else {
fprintf(stderr, "Backtrace error %d: %s\n", error_number, message);
};
};
static int full_callback (void *data, uintptr_t pc, const char *pathname, int line_number, const char *function) {
static int unknown_count = 0;
if (pathname != NULL || function != NULL || line_number != 0) {
if (unknown_count) {
fprintf(stderr, " ...\n");
unknown_count = 0;
};
const char *filename = rindex(pathname, '/');
if (filename) filename++; else filename = pathname;
fprintf(stderr, " %s:%d -- %s\n", filename, line_number, function);
} else {
unknown_count++;
};
return 0;
};
struct backtrace_state *state;
void sigsegv_handler (int number) {
fprintf(stderr, "\n*** Segmentation Fault ***\n\n");
backtrace_full(state, 0, full_callback, error_callback, NULL);
printf("\n");
//backtrace_print(state, 0, stderr);
_Exit(1);
};
void function_two () {
*((void **) 0) = 0; // program crashes here
};
void function_one () {
function_two();
};
void main () {
signal(SIGSEGV, sigsegv_handler);
state = backtrace_create_state(NULL, 0, error_callback, NULL);
function_one();
};
There's also a backtrace_print function in there which is commented out, but if you don't mind your backtraces being ugly then you don't even need 90% of what's in my test program and can just use that instead. Also I tested it calling backtrace_create_state from within the signal handler and that works too, FWIW.
Oh, and the second parameter to backtrace_create_state has something to do with whether to support threads, so maybe it should be 1 instead of 0. The documentation is in the header file.
...one hour later...
After another half-hour it did it again. ...and no backtrace. 🙁
Loading the core file into gdb doesn't produce one either. It must be overwriting the stack I guess.